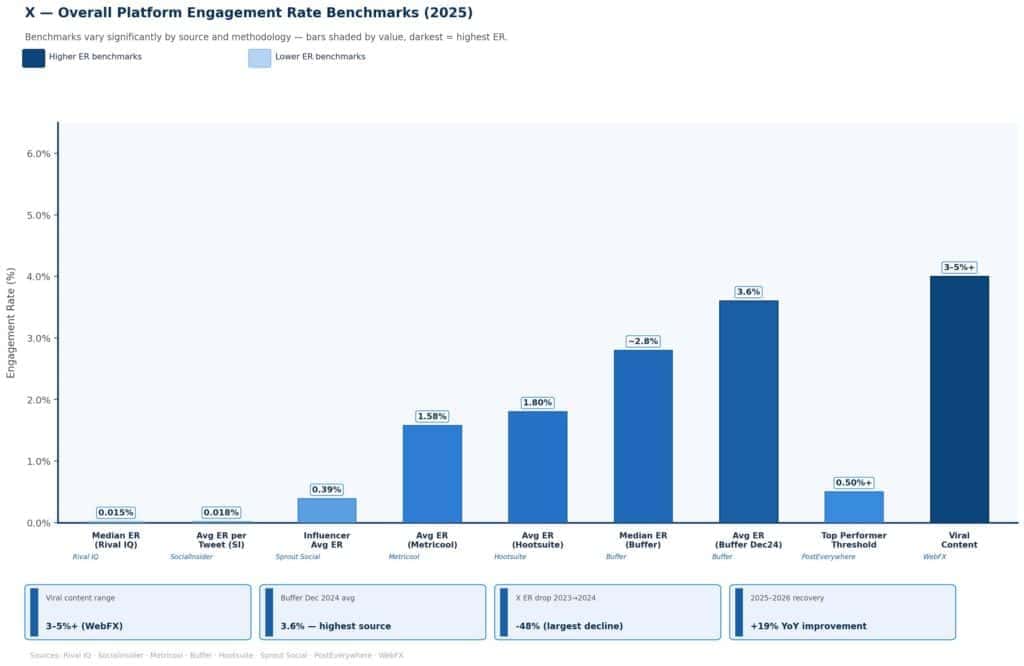
Twitter (X) presents a uniquely fragmented engagement picture in 2026. Platform-wide median rates (measured as interactions ÷ followers) sit as low as 0.015%–0.029% per Rival IQ’s methodology, while impression-based and post-level calculations produce vastly higher figures — from 1.58% (Metricool) to 2.8% (Buffer). Understanding which denominator a benchmark uses is essential before comparing your account’s performance. Despite declining organic reach, X showed its first meaningful engagement rebound in 2026 — with a 19% climb in engagement rate year-over-year even as impressions fell 5%.
How Engagement Rate Is Calculated on X
There is no single industry-standard formula for X engagement, which explains the wide variance across benchmark providers:
- Follower-based ER = (Likes + Replies + Retweets) ÷ Followers × 100 — used by Rival IQ; produces the lowest numbers
- Impression-based ER = Total Interactions ÷ Impressions × 100 — used by Social Status, Metricool; reflects actual reach; recommended for content optimization
- Post-level ER = Total Engagements per Post ÷ Total Posts — used by Hootsuite and Buffer; tends to produce mid-range values
The Social Status methodology is considered the most accurate, incorporating likes, replies, retweets, video views/engagements, URL clicks, profile clicks, hashtag clicks, and detail expands — all divided by impressions.
Overall Platform Benchmarks
| Metric | Benchmark | Source |
| Median ER (all industries, follower-based) | 0.015% | Rival IQ |
| Average ER (impression-based, 2025) | 1.58% | Metricool |
| Median ER (Buffer, 2025) | ~2.8% | Buffer |
| Average ER (Hootsuite, all industries) | 1.8% | Hootsuite |
| Average ER (Buffer, Dec 2024) | 3.6% | Buffer |
| Average ER per tweet (Socialinsider, 850K posts) | 0.018% | Socialinsider |
| Influencer avg ER per post (2025) | 0.39% | Sprout Social |
| “Good” threshold (follower-based) | ≥0.020% median | Sprout Social |
| “Good” threshold (impression-based) | 0.15%–0.30% | PostEverywhere |
| Top-performer threshold | 0.50%+ (impression-based) | PostEverywhere |
| Viral content range | 3%–5%+ | WebFX |
Key trend: X engagement dropped 48% between 2023 and 2024 (the largest decline of any major platform), but 2025–2026 data shows the first recovery — a +19% YoY improvement in engagement rate as impressions contracted. The platform is shedding passive scrollers and retaining active participants.
Engagement Rate by Industry
Rival IQ (Follower-Based Median — 2025 Report)
These figures reflect true per-follower median rates and are the most conservative benchmarks available:
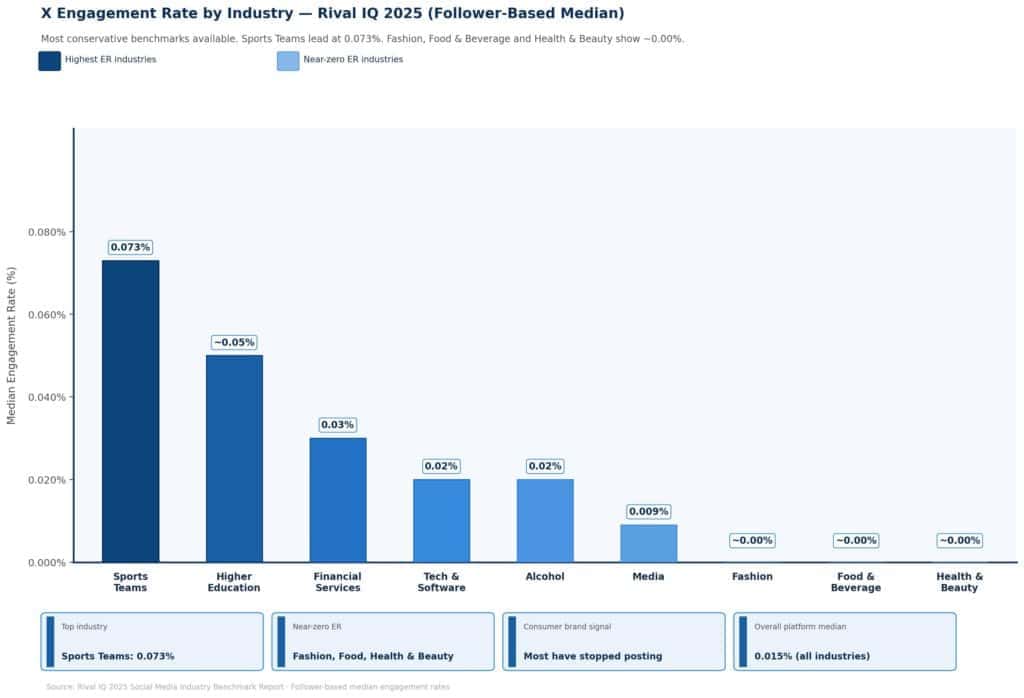
| Industry | Median ER |
| Sports Teams | 0.073% |
| Higher Education | ~0.05% |
| Financial Services | 0.03% |
| Tech & Software | 0.02% |
| Alcohol | 0.02% |
| Fashion | 0.00% |
| Food & Beverage | 0.00% |
| Health & Beauty | 0.00% |
| Media | 0.009% |
Sports teams achieved the highest median engagement rate of any industry on X, while Fashion, Food & Beverage, and Health & Beauty showed effectively zero engagement to two decimal places — a stark signal that most consumer brands have either stopped posting or see no return.
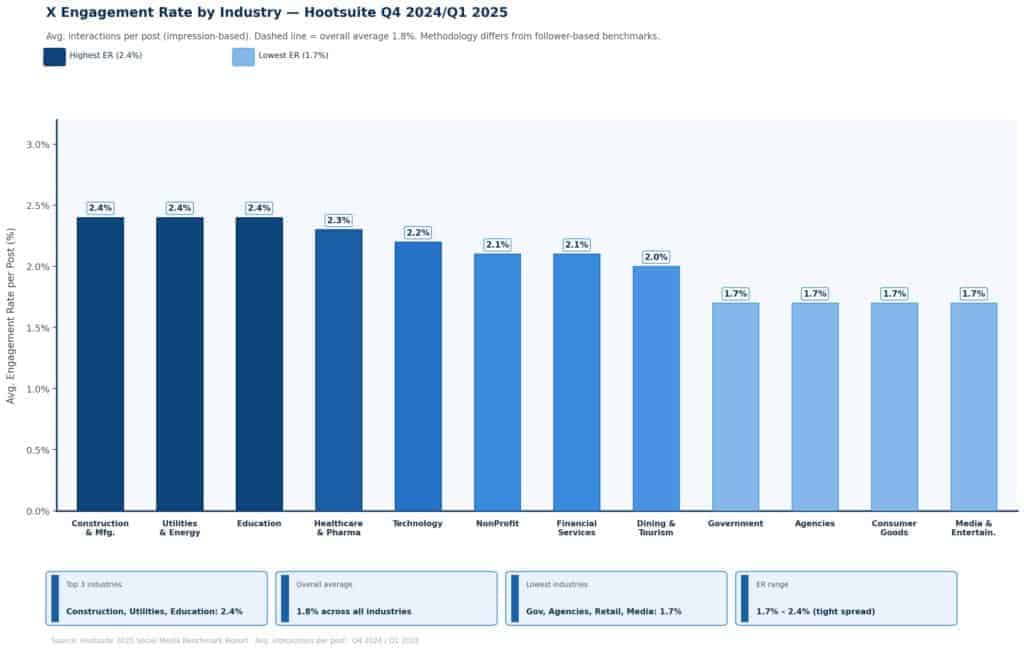
Hootsuite (Average ER per Post — Q4 2024/Q1 2025)
Hootsuite’s methodology produces substantially higher figures since it measures average interactions per post rather than interactions relative to total followers:
| Industry | Avg. X Engagement Rate |
| Healthcare, Pharma & Biotech | 2.3% |
| Construction, Manufacturing | 2.4% |
| Utilities & Energy | 2.4% |
| Education | 2.4% |
| Technology | 2.2% |
| NonProfit | 2.1% |
| Financial Services | 2.1% |
| Dining/Hospitality/Tourism | 2.0% |
| Government | 1.7% |
| Agencies | 1.7% |
| Consumer Goods & Retail | 1.7% |
| Media & Entertainment | 1.7% |
| Overall Average | 1.8% |
Engagement Rate by Content Format
Content type is one of the most powerful levers for improving X engagement. Data from multiple sources in 2025:
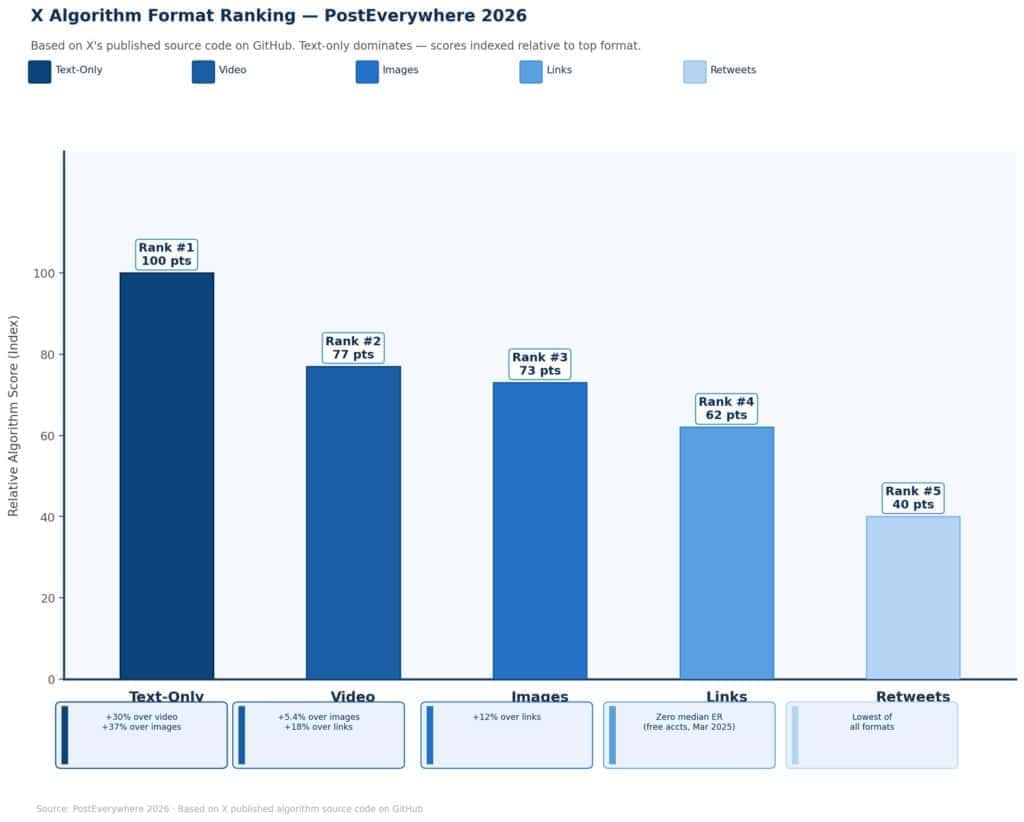
X Algorithm Format Ranking (PostEverywhere, 2026)
Based on X’s published source code on GitHub:
| Rank | Format | vs. Next Format |
| 1 | Text-only | +30% over video; +37% over images |
| 2 | Video | +5.4% over images; +18% over links |
| 3 | Images | +12% over links |
| 4 | Links | Zero median ER for free accounts (since March 2025) |
| 5 | Retweets | Lowest of all formats |
Sprout Social Influencer Data (2025 avg ER per post)
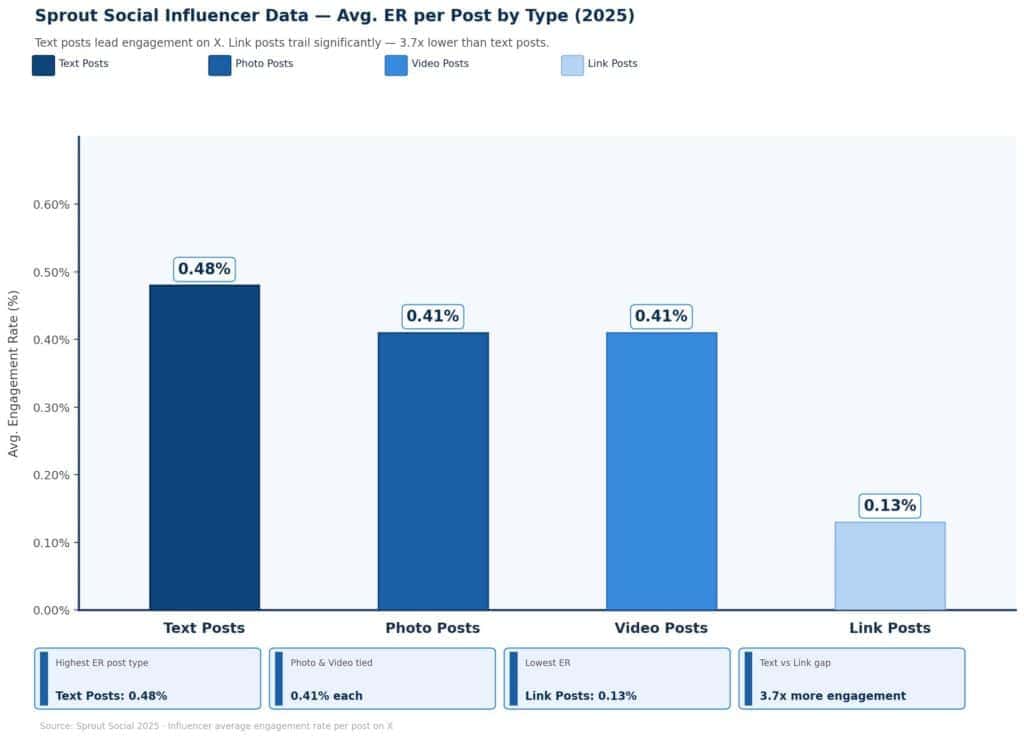
| Post Type | Avg. Engagement Rate |
| Text posts | 0.48% |
| Photo posts | 0.41% |
| Video posts | 0.41% |
| Link posts | 0.13% |
Adilo Post-Type Analysis (2025, avg across 850K+ posts)
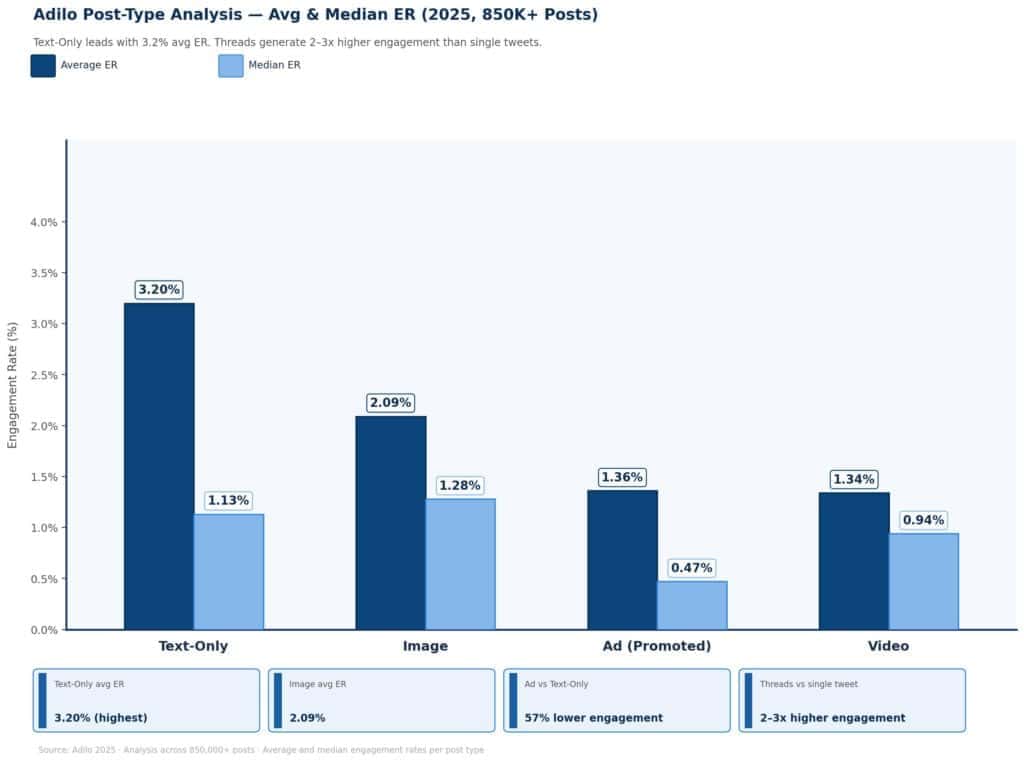
| Post Type | Average ER | Median ER |
| Text-Only | 3.2% | 1.13% |
| Image | 2.09% | 1.28% |
| Ad (Promoted) | 1.36% | 0.47% |
| Video | 1.34% | 0.94% |
Key insight: Text-only and native images consistently outperform links, which have seen near-zero distribution for free accounts since March 2025. Threads (multi-tweet series of 5–10 tweets) generate 2–3x higher engagement than single tweets.
Engagement Rate by Account Size (Follower Count)
Smaller accounts consistently achieve higher engagement rates — a universal pattern on X driven by closer community connections:
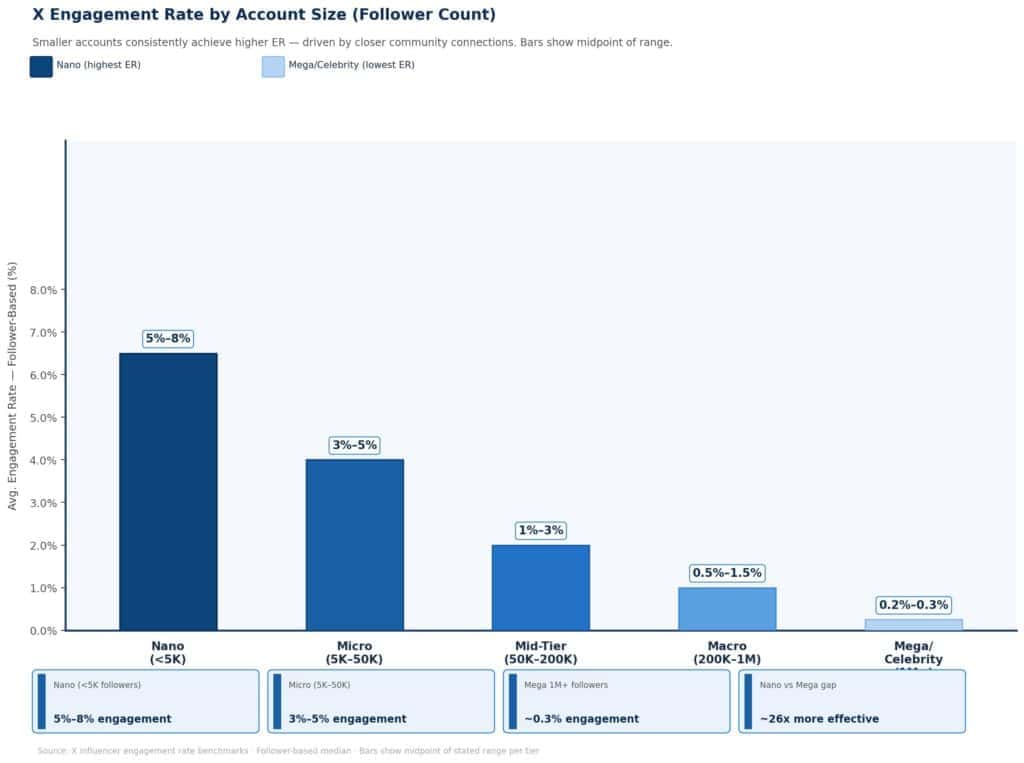
| Tier | Follower Range | Avg. ER (Follower-Based) |
| Nano | < 5K | 5%–8% |
| Micro | 5K–50K | 3%–5% |
| Mid-Tier | 50K–200K | 1%–3% |
| Macro | 200K–1M | 0.5%–1.5% |
| Mega / Celebrity | 1M+ | 0.2%–0.3% |
Nano-influencers on X average roughly 1% engagement, while mega accounts (1M+ followers) average approximately 0.3%. For brands, this means partnering with smaller, niche-focused accounts typically delivers more impactful engagement per impression.
X vs. Other Platforms
X sits at the bottom of engagement rankings among major social platforms — yet its 2026 trajectory diverges from most peers:
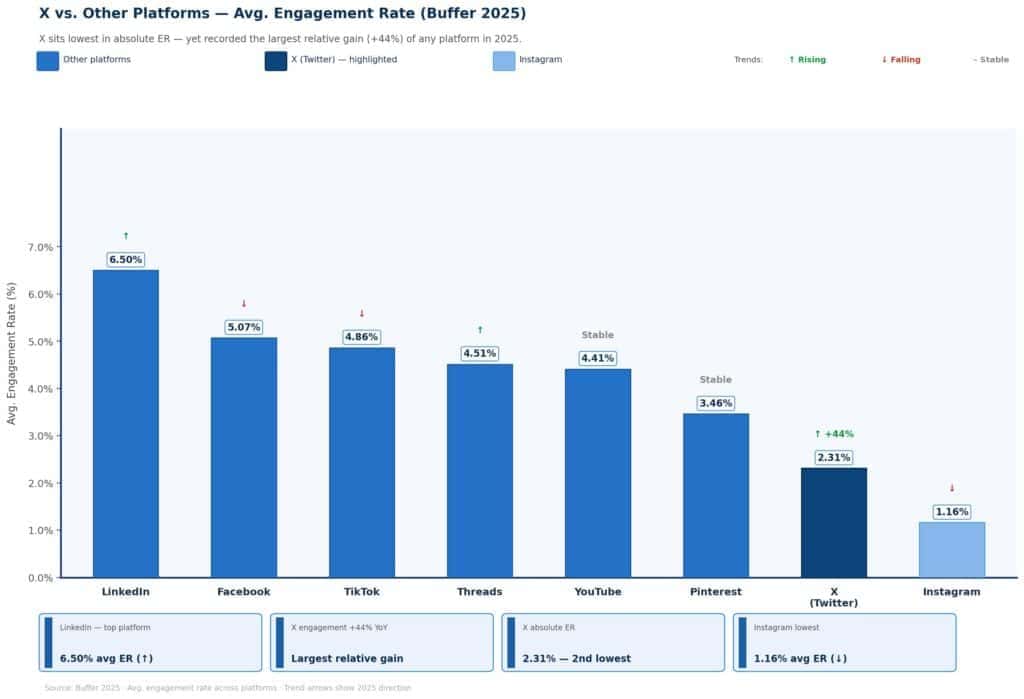
| Platform | Avg. Engagement Rate | 2025 Trend |
| 6.50% | ↑ | |
| 5.07% | ↓ | |
| TikTok | 4.86% | ↓ |
| Threads | 4.51% | ↑ |
| YouTube | 4.41% | Stable |
| 3.46% | Stable | |
| X (Twitter) | 2.31% | ↑ +44% |
| 1.16% | ↓ |
Source: Buffer 2025. X recorded the largest relative engagement rate gain (+44%) of any platform in 2025, even while remaining the lowest in absolute terms.
Key Interaction Metrics (2025 Averages per Post)
Based on Sprout Social and Metricool data across 2024–2025:
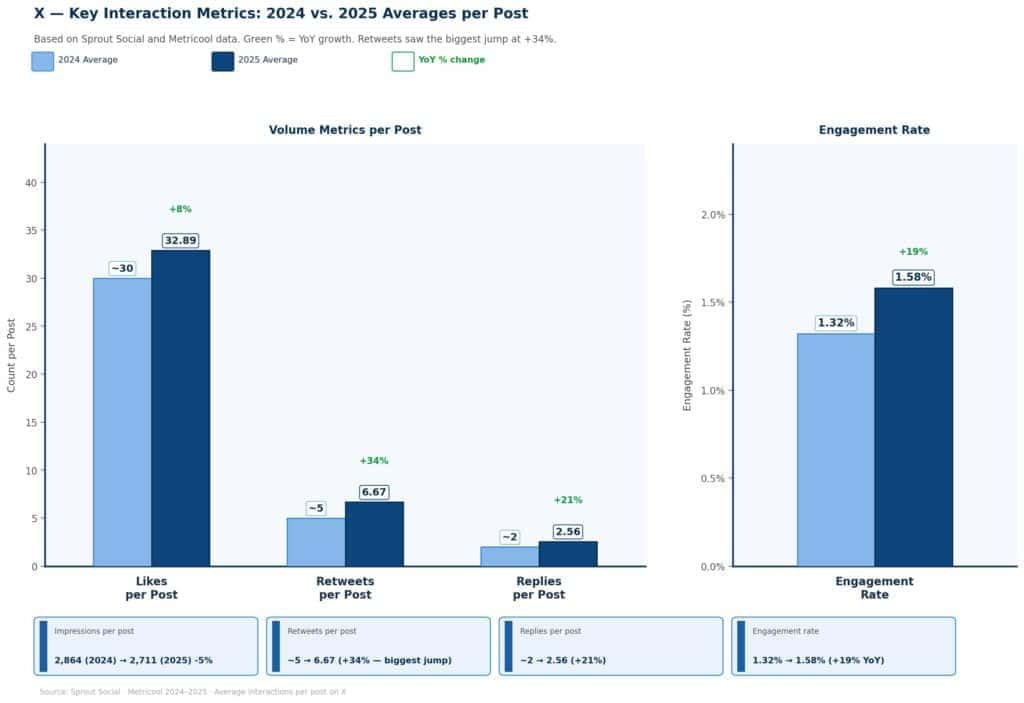
| Metric | 2024 Avg | 2025 Avg | Change |
| Impressions per post | 2,864.78 | 2,711.29 | –5% |
| Likes per post | ~30 | 32.89 | +8% |
| Retweets per post | ~5 | 6.67 | +34% |
| Replies per post | ~2 | 2.56 | +21% |
| Engagement rate | 1.32% | 1.58% | +19% |
Replies saw a 21% increase in 2025 — confirming X’s recovery of its position as a forum for real-time public discourse. Retweets saw the biggest jump (+34%), signaling a “sharing” behavioral shift.
Advertising Benchmarks
For teams running paid campaigns on X:
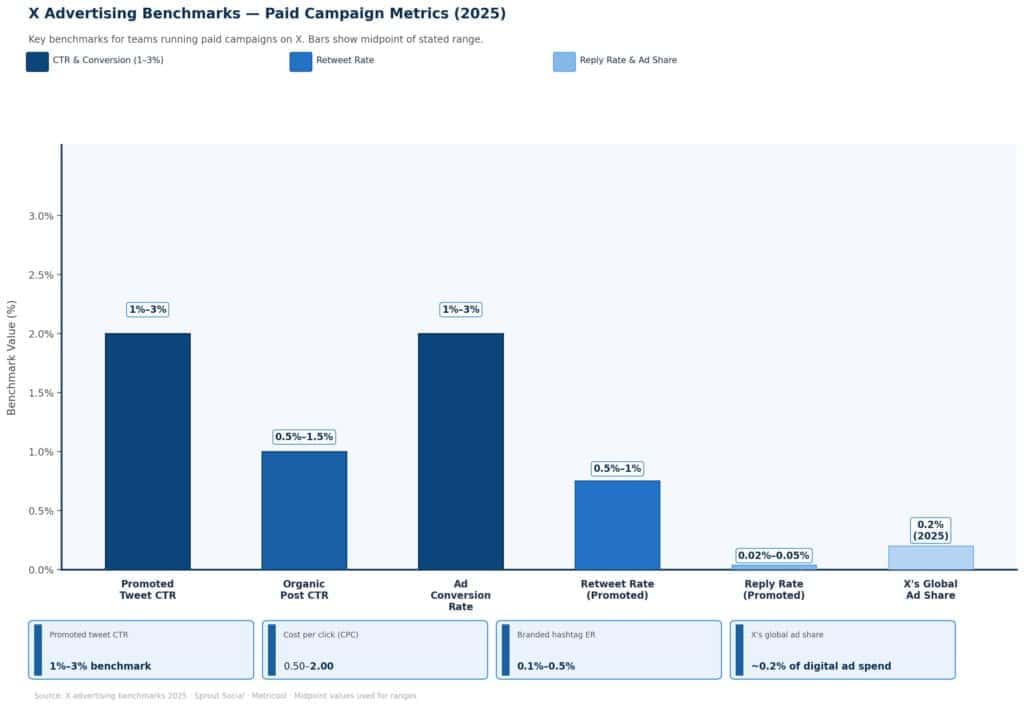
| Ad Metric | Benchmark |
| Promoted tweet CTR | 1%–3% |
| Organic post CTR | 0.5%–1.5% |
| Ad conversion rate | 1%–3% |
| Cost per click (CPC) | $0.50–$2.00 |
| Reply rate (promoted tweets) | 0.02%–0.05% |
| Retweet rate (promoted) | 0.5%–1% |
| X’s share of global digital ad spend | 0.2% (2025) |
Branded hashtags achieve 0.1%–0.5% engagement, while trending hashtags can push 2%–5%. Using 1–2 hashtags is optimal — more than three hashtags decreases engagement.
What Defines a “Good” Engagement Rate in 2026
The answer depends entirely on measurement methodology and account size:
- Follower-based (Rival IQ): ≥0.020% median is considered “good” for brands; ≥0.08% puts an account in the top 25%
- Impression-based: 0.15%–0.30% is good; 0.50%+ is top-tier
- For small accounts (<10K followers): Aim for 1.0%+ (follower-based)
- For large accounts (500K+): 0.2%–0.4% is a realistic target
- X Premium accounts: Receive up to 10x more reach than free accounts, structurally improving all engagement metrics
Crypto-focused accounts average 4.2% engagement versus the 2.9% platform average. Technology sector content performs better on X than on LinkedIn (1.27%) or Instagram (1.25%) when measured by certain cross-platform benchmarks.
Content Strategy Recommendations for Higher Engagement
- Prioritize text-only and native image posts — links get near-zero reach for non-Premium accounts since March 2025
- Use threads (5–10 tweets) — these generate 2–3x higher engagement than single tweets
- Post mid-week mornings — Tuesday at 9 AM (Buffer), Wednesday at 9 AM (PostEverywhere), and Tuesday–Thursday 12–6 PM (Sprout Social) are peak windows
- Drive replies over likes — the X algorithm weights a reply at 150x a like; “hot takes” and strong opinions structurally outperform passive content
- Consider X Premium — Premium subscribers receive 10x more in-network reach and 2x out-of-network visibility, fundamentally altering the engagement ceiling
- Limit hashtags to 1–2 per post — more than three hashtags decreases engagement
- Engage in the first 30 minutes — early engagement after posting determines algorithm distribution and amplification.