Twitter (now rebranded as X) has faced a significant retention and follower churn challenge since Elon Musk’s acquisition in October 2022. Unfollowing behavior is driven by a combination of content quality issues, platform changes, and bot purges. This report synthesizes available statistics on unfollow rates, reasons for unfollowing, platform-level user decline, and engagement benchmarks to provide a comprehensive picture.
Platform-Level User & Follower Decline
Overall User Loss Since Rebrand
Twitter’s user base underwent notable decline following the 2022 acquisition and 2023 rebrand to X:
- Daily active users in the U.S. declined 23% between November 2022 and February 2024, according to app analytics firm Sensor Tower.
- Globally, X saw a 15% decrease in daily active users over the same period, bringing totals to approximately 174 million daily active users.
- A study from Edison Research found that usage of X dropped 30% from 2023 to 2024 — the share of the U.S. population using X fell from 27% in 2022–2023 to just 19% in 2024.
- Monthly active users declined from 368.4 million in 2023 to 335.7 million in 2024, per Statista data.
- X’s ad reach dropped by 33 million users (–5.3%) between January 2024 and January 2025, falling to 586 million reachable users.
- The number of monthly X users dropped 15% in the first year after Musk’s takeover, primarily attributed to concerns over hate speech proliferation and reduced content moderation.
Follower Growth Rate Benchmarks (2025)
Net follower growth across industries on X (Twitter) is very low compared to other platforms:

| Industry | X (Twitter) Weekly Follower Growth Rate | Instagram Weekly Growth | TikTok Weekly Growth |
| Entertainment & Media | 0.15% | 1.82% | 1.51% |
| Financial Services | 0.00% | 2.26% | 0.98% |
| Dining / Hospitality / Tourism | 0.00% | 1.10% | 18.75% |
| Healthcare | 0.00% | 1.10% | 1.82% |
| Retail | 0.03% | 1.02% | 0.91% |
| Marketing Agencies | 0.00% | 1.36% | 6.08% |
| Nonprofit | 0.00% | 0.62% | 2.15% |
Source: Hootsuite Social Media Benchmarks 2025
The overall weekly follower growth rate for X averages just 0.11% across all accounts and industries, the lowest among major social platforms and reflecting elevated churn rates that offset any new follows gained.
Brand Account Unfollow Rates
Frequency of Unfollowing Brand Accounts
Research from BuzzStream and Fractl (surveying 900+ respondents) provides a direct baseline for brand account unfollow behavior:
- 12% of Twitter users unfollowed a brand in the last few days, a notably high short-term churn rate for brands.
- By comparison, 25% of Facebook users unfollowed a brand in the last month, and 49% of LinkedIn users have never unfollowed a brand.
An industry-specific study among 17 mountain resort Twitter accounts (average ~6,000 followers) found:
- Resorts averaged 11.25 new follows and 3.94 unfollows per day, resulting in a net gain of 7.31 followers/day.
- This implies an unfollow rate of approximately 35 per 100 new followers gained — meaning for every 100 people who followed, about 35 unfollowed.
A separate study found that 15% of Twitter users will unfollow a business within 3 weeks if the brand fails to engage early with its new audience.
Top Reasons People Unfollow on Twitter
General User Accounts
According to an eConsultancy TwitPoll survey, the leading reasons Twitter users unfollow accounts are:

| Reason | % of Users Citing |
| Tweeting too often / too much noise | 52% |
| Too much self-promotion | 48% |
| Posting too much spam | 47% |
| Not interesting enough | 43% |
| Too much repetition | 29% |
A KAIST academic study (“Analysis of Twitter Unfollow: How Often and Why”) using user interviews found four qualitative top reasons:
- Burst tweets (posting too many tweets in a short time)
- Tweets about uninteresting topics
- Tweets about mundane daily life details, including auto-generated posts (e.g., Foursquare check-ins)
- Tweets about political issues (depending on audience)
The same study found that one-way relationships are 2.17x more likely to be broken than mutual/reciprocal follows, and that if one relationship in a pair is broken, there is a 23.45% conditional probability that the remaining relationship will also break.
Brand / Business Account Unfollowing
Research on why users unfollow brand accounts highlights content quality and frequency as primary drivers:
- 21% of users unfollow because content is repetitive and boring.
- 19% unfollow if a brand posts too frequently (defined as more than 6 times per day on Facebook, with similar thresholds on Twitter).
- 85.12% of social media users have unfollowed a brand or person at some point, according to a GoodFirms Social Media Usage Survey (2019).
Indonesia-Specific Data (Twitter, 2019)
A JakPat survey of Indonesian Twitter users found the following reasons for unfollowing:
- Posting spam: 23.9% (the leading reason)
- Additional factors included inactivity, uninteresting content, and excessive promotional posting
Japan-Specific Data (Corporate Accounts, 2020)
A survey by Allied Architects in Japan found reasons users unfollowed official corporate Twitter accounts:
- Too little new information about products/services: 37%+ of respondents
- Too few Twitter campaigns to participate in: 31%+
Engagement Rate Decline & Passive Follower Churn
Engagement rate decline is closely correlated with passive follower churn on X:
- The median engagement rate on X declined from 0.029% in 2024 to 0.015% in 2025, based on Rival IQ data — a 48% drop, the steepest cross-platform decline of any major social network from 2023 to 2024.
- Engagement on X declined 48% from 2023 to 2024, the largest decrease among all major social media platforms.
- B2B organic reach for X accounts with 10,000 followers fell to 2.3% of their audience in 2025, compared to 8.7% in 2020.
- The average X post received 31.46 likes in 2024, down from 37.82 in 2023, while reposts fell from 4.1 to 1.56 and mentions fell from 11.06 to 8.47.
Twitter/X Engagement Rate by Industry (India, 2025)
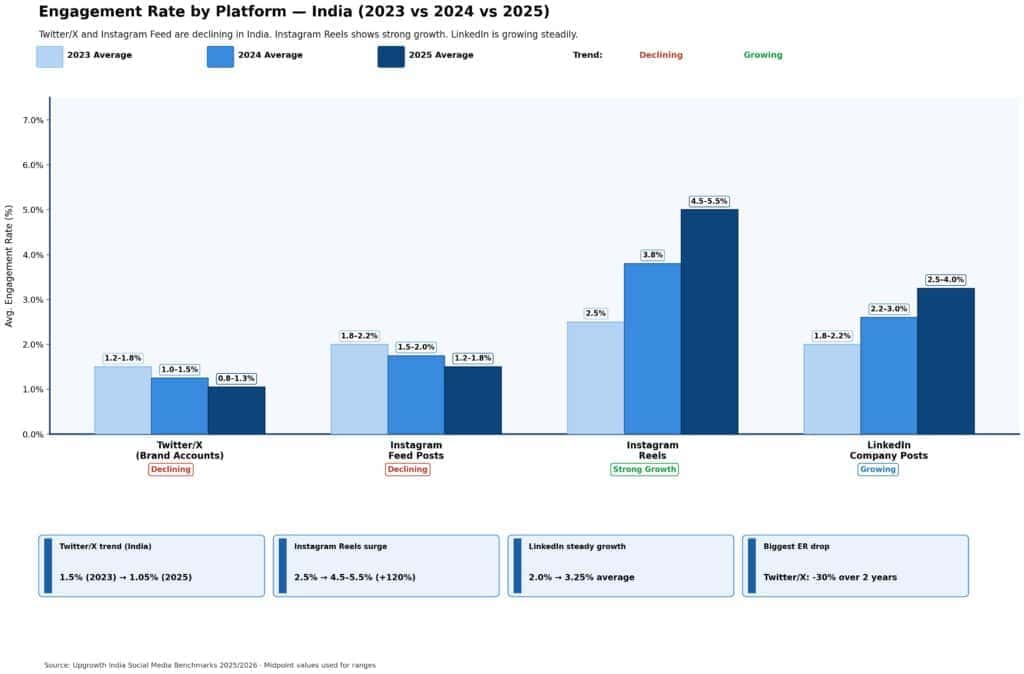
| Platform | 2023 Average | 2024 Average | 2025 Average | Trend |
| Twitter/X (Brand Accounts) | 1.2–1.8% | 1.0–1.5% | 0.8–1.3% | Declining |
| Instagram Feed Posts | 1.8–2.2% | 1.5–2.0% | 1.2–1.8% | Declining |
| Instagram Reels | 2.5% | 3.8% | 4.5–5.5% | Strong Growth |
| LinkedIn Company Posts | 1.8–2.2% | 2.2–3.0% | 2.5–4.0% | Growing |
Source: Upgrowth India Social Media Benchmarks 2025/2026
Platform-Level Structural Factors Driving Unfollows
Several X-specific platform changes have structurally affected follower retention:
- Bot purges: In October 2025 alone, X removed 1.7 million bot accounts in a major cleanup targeting reply spam, directly causing follower count drops for many accounts.
- Algorithmic feed changes: The “Following” feed is now algorithmically sorted rather than chronological, meaning even genuine followers may never see content — reducing perceived value and prompting unfollows.
- External link suppression: Since March 2026, non-Premium accounts posting links receive near-zero engagement due to active algorithmic suppression.
- Tweet half-life: A tweet loses approximately 50% of its visibility score every 6 hours, creating a “now-or-never” dynamic that contributes to audience disengagement over time.
User Retention Differentiated by Engagement Type
- Twitter Premium (X Blue) subscribers show an 82% retention rate, significantly higher than the general user base.
- Thread authors show 24% lower churn compared to single-tweet posters.
- Users following 20+ accounts show 3.1x higher retention than those following fewer accounts.
- Push notifications improve 7-day retention by 31%.
- X’s brand health score fell from +2.7 (mildly positive) pre-Musk to –12.4 by late 2024, with satisfaction among current users dropping from +10.7 to –1.4.
Reciprocity and Relationship Dynamics
Academic analysis from the KAIST “Analysis of Twitter Unfollow” study provides the most granular quantitative data on unfollow probability:
- Non-reciprocal (one-way) relationships have a broken probability of 12.28%, compared to just 5.29% for reciprocal/mutual relationships.
- Non-reciprocal follows are 2.17x more likely to result in an unfollow.
- If the Jaccard coefficient of hashtag overlap (shared topic interest) decreases by 0.2, unfollow likelihood increases 2.75x.
- If overlap in who two users follow decreases by 0.2, unfollow likelihood increases 2.12x.
- Receiving actions (replies, mentions from followees) is a stronger predictor of a relationship surviving than giving them — people value being acknowledged.
Key Takeaways
- Twitter/X has the lowest follower growth rate among major platforms (0.11% weekly average), indicating that unfollows largely cancel out new follows in many industries.
- The most common reason users unfollow is posting too frequently (52%), followed by excessive self-promotion (48%) and spam (47%).
- 15% of users unfollow a brand within 3 weeks if the brand fails to engage new followers early — a critical window for audience retention.
- For every 100 new Twitter followers a brand gains, approximately 35 may unfollow within the observed period, based on resort industry data.
- Bot purges, algorithmic changes, and the platform’s declining brand health are structural forces compounding organic unfollow behavior.
- Mutual relationships, shared interests (topic overlap), and paid subscriptions are the strongest predictors of follower retention on X.