Twitter — rebranded as X in July 2023 — remains one of the world’s most actively used real-time social platforms. While its user base has evolved under Elon Musk’s ownership, daily engagement figures remain substantial, with hundreds of millions opening the app every day. Understanding how often people check X, and for how long, reveals patterns that matter for marketers, publishers, and content creators alike.
Key Takeaways
- Most active X users check the platform multiple times per day — at least 68–72% do so.
- The average user spends 28–34 minutes per day on the platform, implying roughly 3–4 daily sessions.
- Peak times are 8–9 AM and 5–6 PM, aligned with daily commutes.
- Engagement is concentrated: power users (top 10%) dominate posting, spending nearly an hour per day.
- Only 44% of monthly users log in daily, so high-frequency checking is characteristic of the most engaged segment, not the entire registered base.
Twitter (X) Daily Login Frequency
The most direct answer: the majority of active Twitter/X users check the platform multiple times per day.
- 72% of users check X multiple times per day.
- 68% of users open the app more than once a day, according to separate estimates.
- 56–52% of users access the platform on a daily basis.
- 84% of users check in at least weekly.
- 96% of U.S. users engage with the platform at least once a month.
These figures suggest that while a large portion of the registered user base is not daily active, among those who do log in, multiple-visit-per-day behavior is the norm rather than the exception.
In Japan, one of X’s most engaged markets, a June 2023 survey found that nearly 24% of users opened Twitter more than 10 times per day, and 81.4% of users accessed it on a daily basis. In the UK, approximately 60% of users logged in daily as of Q3 2020.
Time Spent Per Day on Twitter (X)
Time-on-platform data corroborates the high-frequency check-in behavior:
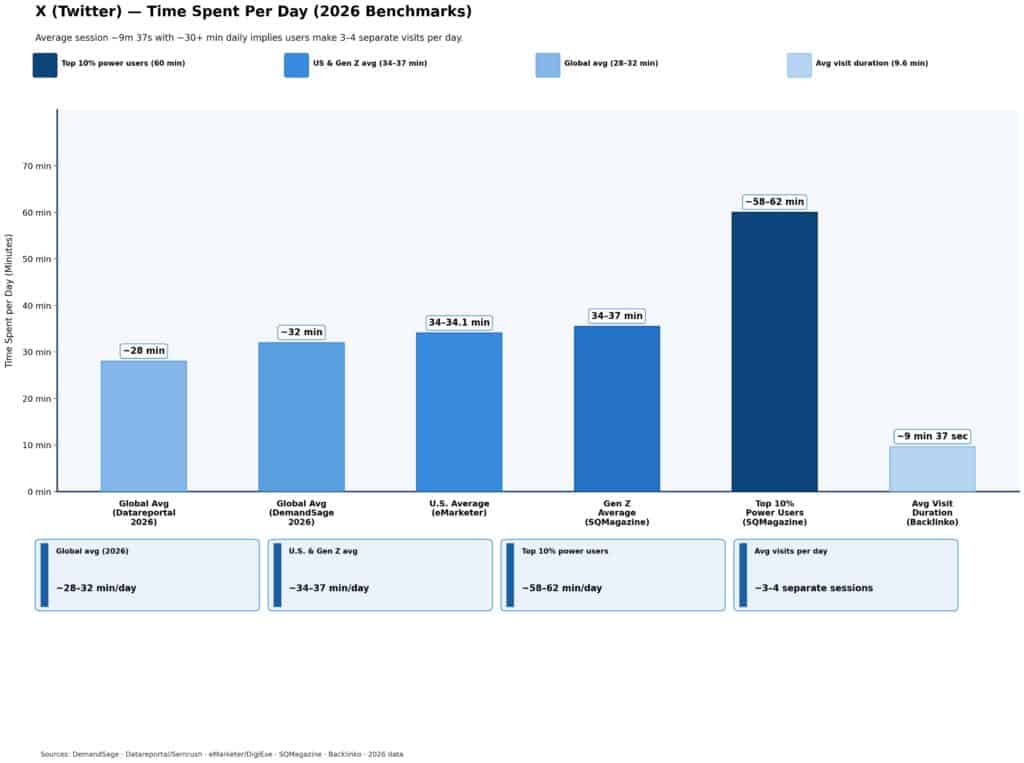
| Metric | Value | Source |
| Global average time per day (2026) | ~32 minutes | DemandSage / SQMagazine |
| Global average time per day (Datareportal 2026) | ~28 minutes | Datareportal / Semrush |
| U.S. average time per day | 34–34.1 minutes | eMarketer / DigiExe |
| Gen Z average time per day | 34–37 minutes | SQMagazine |
| Top 10% power users | ~58–62 minutes/day | SQMagazine |
| Average visit duration (per session) | ~9 min 37 sec | Backlinko |
The average session lasting under 10 minutes, combined with nearly a third of an hour spent daily, implies users are making 3–4 separate visits to the platform per day on average.
Twitter (X) Peak Usage Times
Usage is not uniformly distributed throughout the day. X sees clear spikes during:
- Morning commute: 8–9 AM — users check news and trending topics before/during work.
- Evening commute: 5–6 PM — second peak as users wind down work and switch to leisure browsing.
This commute-anchored pattern reinforces X’s identity as a real-time news and information platform rather than a passive entertainment feed.
How Twitter (X) Compares to Other Platforms
Daily time spent on X sits in the mid-tier among major social platforms:
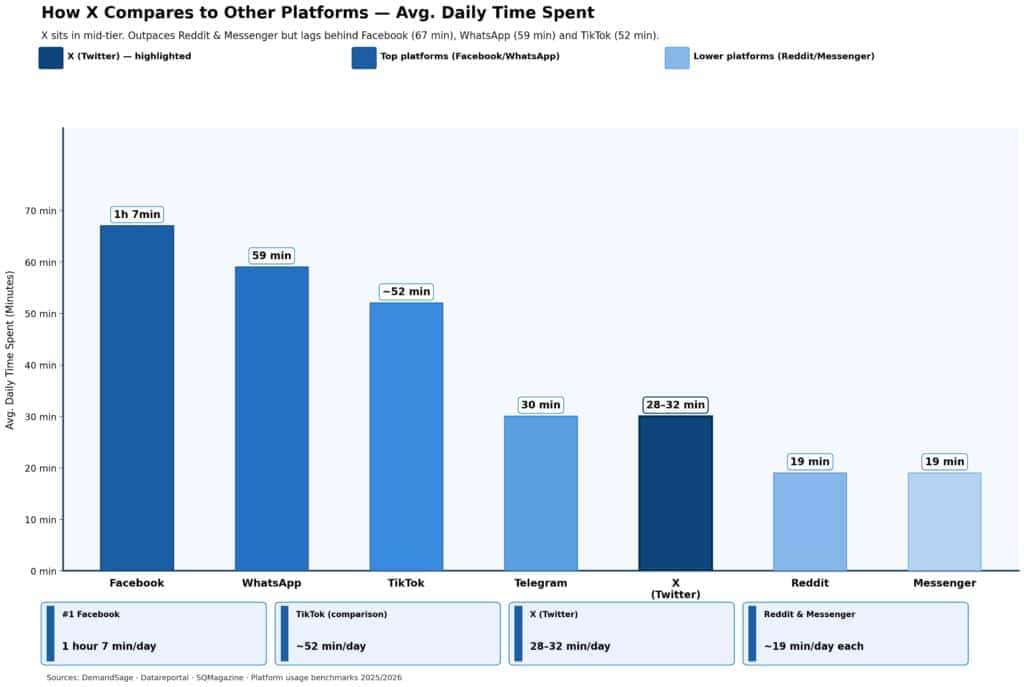
| Platform | Avg. Time Per Day |
| 1 hour, 7 minutes | |
| 59 minutes | |
| Telegram | 30 minutes |
| X (Twitter) | 28–32 minutes |
| 19 minutes | |
| Messenger | 19 minutes |
X outpaces Reddit and Messenger but lags behind WhatsApp and Facebook in total daily engagement. Compared to TikTok (approximately 52 minutes/day), X users spend considerably less time per day.
Twitter (X) Engagement Concentration
A critical nuance: X’s engagement is highly skewed. The top 10% of users generate 92% of all posts on the platform. This means that while checking frequency is high among active users, a large portion of the registered base is relatively passive — logging in to consume content rather than to post. Only 44% of monthly users log in daily, meaning more than half of the monthly base does not visit every day.
Global Daily Active Users on Twitter (X)
X’s total daily active user base sits at approximately:
- 245–259 million DAUs globally (company estimates and independent analysis).
- 132 million mobile DAUs (iOS + Android), representing a 15.2% year-over-year decrease as of June 2025.
The divergence between total DAU estimates and mobile-only figures suggests significant desktop usage, which may account for the higher content consumption per session observed on desktop.